
The United States is a vast country, having the second most tillable land globally and spanning multiple climate zones.1 As such, it can grow a wide variety of crop types. But how does U.S. crop production compare to the rest of the world?
To explore this, we examined data from the Food and Agriculture Organization of the United Nations’ statistical database (FAOSTAT) through the lens of comparative advantage. A natural starting point in examining comparative advantage is yield—production per unit of arable land. Figure 1 presents a series of box-and-whisker plots comparing U.S. yields (indicated by the yellow dash) to those of other reporting countries.
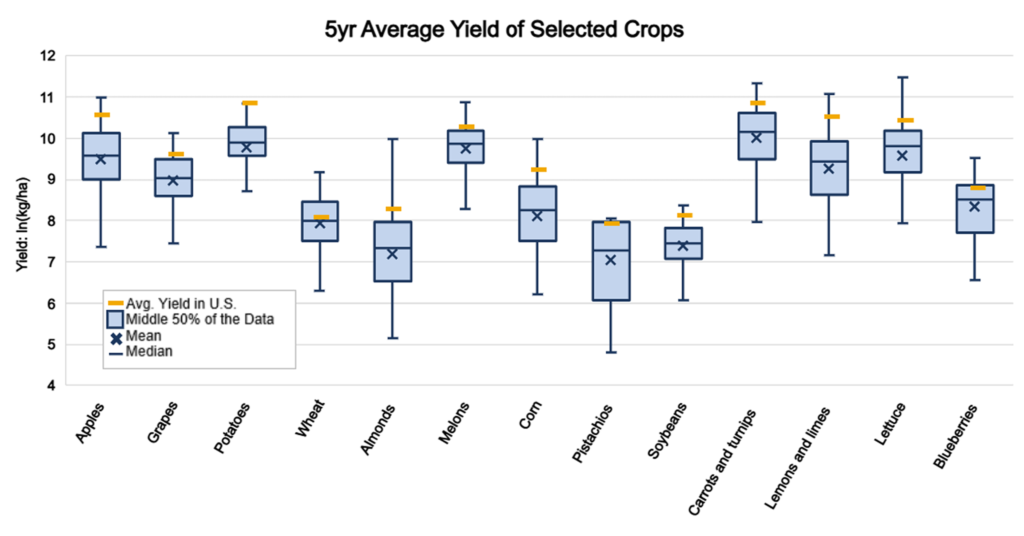
The U.S. generally ranks within the top 25% in yield across the 13 selected crops, with particularly strong performance in potatoes, soybeans, apples, and lemons/limes. However, yield alone doesn’t capture the full picture. How does the U.S. fare in terms of production scale?
Figure 2 builds on the yield data by adding global production ranks for each crop. The U.S. ranks highly in both yield and production for several crops, including pistachios, almonds, soybeans, lettuce, apples, corn, blueberries, and potatoes.
This indicates that the U.S. is not only efficient (high yield) but it also operates at scale (high production). Still, production rank can be misleading. A country ranked third in production may appear strong, but if the top two countries account for more than 90% of total output, its relative contribution is small.
To further illustrate scale, Figure 3 shows the U.S.’s share of global production and exports. Take almonds for example: the U.S. produces roughly 53% of global supply and accounts for about 70% of exports—a strong indicator of comparative advantage. This is likely due to California’s Central Valley, a region with a Mediterranean climate ideal for almond production.2 Pistachios tell a similar story.
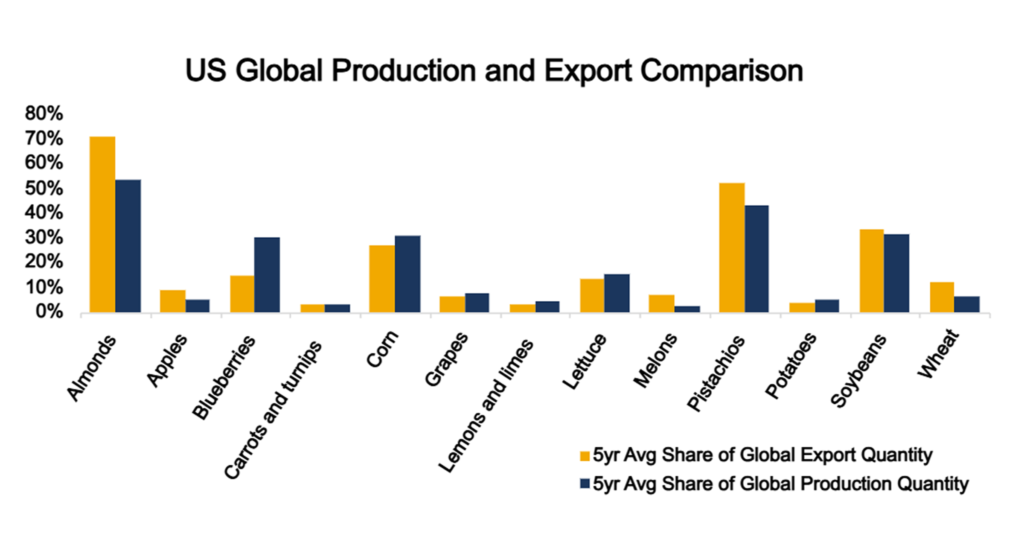
Blueberries offer a contrasting case. While the U.S. produces about 30% of the world’s blueberries—more than any other country—it only accounts for 15% of global exports. This disparity stems from factors like perishability, seasonality, and high domestic demand.
Blueberries are typically consumed fresh and do not store well. U.S. production peaks in the summer, leaving gaps in supply during winter months. Countries like Peru have capitalized on seasonal demand and supply imbalances in the U.S. by producing blueberries during the U.S. off-season, dominating the export market. Accounting for around 50% of global consumption, the U.S. is the world’s largest blueberry consumer.3 The strong domestic market consumes much of the production in the U.S., naturally leaving very little U.S. production to be marketed for export.
As an agricultural investment firm, USAgriculture invests in farmland with characteristics that enable a competitive advantage in a specific crop or the flexibility to support diverse crop rotations. The U.S. is competitive across a broad range of crops—an achievement few countries can match. Combined with a vast infrastructure, strong property rights, a wide range of suitable climates, and stable economic conditions, we believe the United States stands out as one of the best countries in the world to build a diversified farmland portfolio.
